Processing
Categories:
Introduction
In this chapter, you will learn how to improve your images using the Processing panel.
Overview
The Processing panel is the control room for the Process module in ALS.
Located on the right side of the interface, this panel organizes image processing controls into several sections:
-
Histogram
A graphical representation of pixel intensity distribution. -
Auto Stretch
Adjust the strength of the automatic stretch. -
Levels
Fine-tune overall exposure and adjust black and white clipping. -
RGB Balance
Adjust the red, green, and blue levels for color correction.
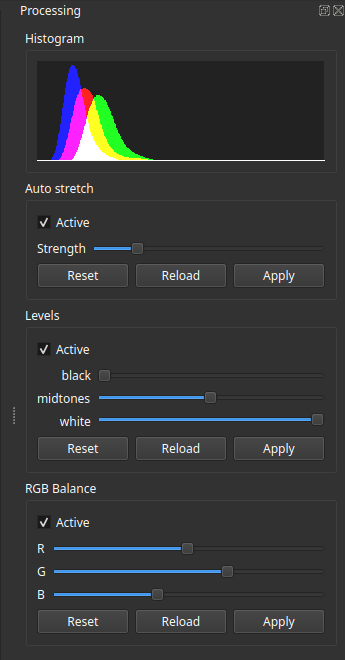
The Processing Panel
Histogram
The Histogram provides a graphical representation of the intensity distribution of pixels within the currently displayed image.
This tool is essential for quickly evaluating tonal and color balance.
Graph Properties
- Horizontal Axis: Indicates pixel intensity, ranging from shadows on the left (low intensity) to highlights on the right (high intensity).
- Vertical Axis: Represents the number of pixels at each intensity level. Higher peaks indicate more pixels within that tonal range.
Monochrome Mode
For monochrome images, a single curve is displayed, showing the intensity distribution of all pixels.
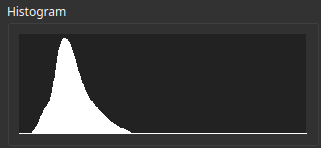
Monochrome Histogram
Color Mode
For color images, the histogram displays separate curves for the three channels: red, green, and blue.
Each curve represents the pixel intensity distribution within its respective channel, showing how each color contributes to the image.
Overlapping regions are displayed in mixed colors that represent the resulting blend.
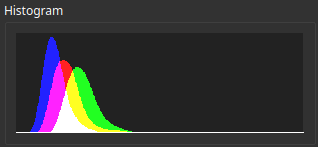
Color Histogram
Processing Controls
This section consolidates the controls for the Process module and its three image processors:
- Auto Stretch
- Levels
- RGB Balance
The controls for each processor are grouped into sections, each with its own sliders and buttons:
Adjustments
Each slider corresponds to an adjustable parameter. No numerical values are displayed, encouraging a more visual and intuitive approach.
Processing panel feature an additional action:🖱️ Double-click the slider handle to reset it to its default position.
Managing and Applying Settings
ApplyGenerates a new image based on the current slider positions.
The central view and histogram update automatically once processing completes.DefaultResets all sliders to their default positions without altering the currently displayed image.ReloadReturns the sliders to the positions they were in whenApplywas last clicked, without modifying the currently displayed image.ActiveEnables or disables the processor. Changing this toggle generates a new image immediately, without needing to clickApply.
Image Adjustments
Auto Stretch
The Auto Stretch section adjusts the intensity of the automatic stretch applied to the image, making stacked images visually usable.
🖱️ Adjust the stretch intensity using the Strength slider.
ℹ️ Default: An ideal balance defined by ALS.
Levels
Black
🖱️ Adjust the Black slider to set the threshold for dark tones.
ℹ️ Default: Leftmost position.
- Analyze the histogram: Observe the far left of the histogram and check the distance between the curves and the left edge.
- Goal: Position the curves to just touch the left edge to optimize dark tones without clipping.
Moving the slider to the right shifts the curves to the left.
Histogram after Black adjustment
White
🖱️ Adjust the White slider to set the threshold for bright tones.
ℹ️ Default: Rightmost position.
- Goal: Visually balance the brightness of highlights while preserving details.
Moving the slider to the left shifts the curves to the right.
Exposure
🖱️ Adjust the Exposure slider to control overall brightness.
ℹ️ Default: Center position.
- Goal: Find the brightness level that best highlights your target, relying on visual perception.
Moving the slider to the right brightens the image.
RGB Balance
The RGB Balance section adjusts the red, green, and blue levels for improved overall color balance.
Analyze the Histogram
Observe the relative positions of the peaks of the three curves.
Your Goal
Achieving a neutral color balance by vertically aligning the main peaks of the three curves is often a good starting point.
Aligning peaks often maximizes the white area of the histogram.
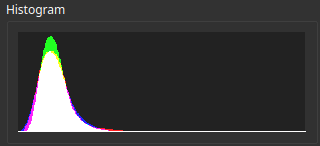
Histogram of a neutral color image
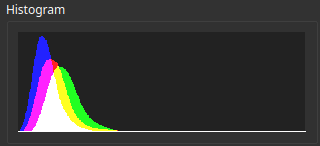
💡 Depending on the target and equipment, histogram curves may lack distinct peaks.
Example: For a target dominated by H-alpha, the red curve will appear flattened without a prominent peak.
The blended colors of the histogram effectively reflect the image’s red dominance.
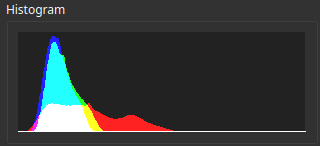
Histogram of an H-alpha target
Slider Actions
Each slider adjusts the horizontal position of its respective curve.
Moving the slider to the right shifts the curve to the right.